Microbiome Health Assessment In Greenhouses – Part 1
The Great Unknown: Microbes in Greenhouses
With crop losses of billions of dollars annually, microbial diseases pose a large threat for the hydroponics sector. As most farmers know, the recirculation water in a hydroponics installation is one of the main sources responsible for the introduction and spread (so-called “vector”) of phytopathogens. Hydroponics systems therefore require almost constant water management to control microbial disease pressures on the crops. To be able to manage these systems KYTOS helps farmers and other stakeholders:
- Identify the water sources where there is a low microbial health situations
- Connect the health deviations with climate and other operational factors
- Assess the risk for a disease outbreak
- Take action via the right treatments
Unfortunately, information regarding the microbiome health within hydroponics greenhouses is incredibly scarce. This makes it difficult for farmers, but also solution providers to know what’s really happening in their greenhouse(s). KYTOS partnered with Tomato Masters to finally shed a first light on the microbial health status within tomato greenhouses. We are proud to share our results with the world.
Our Sampling Approach for Three Greenhouses
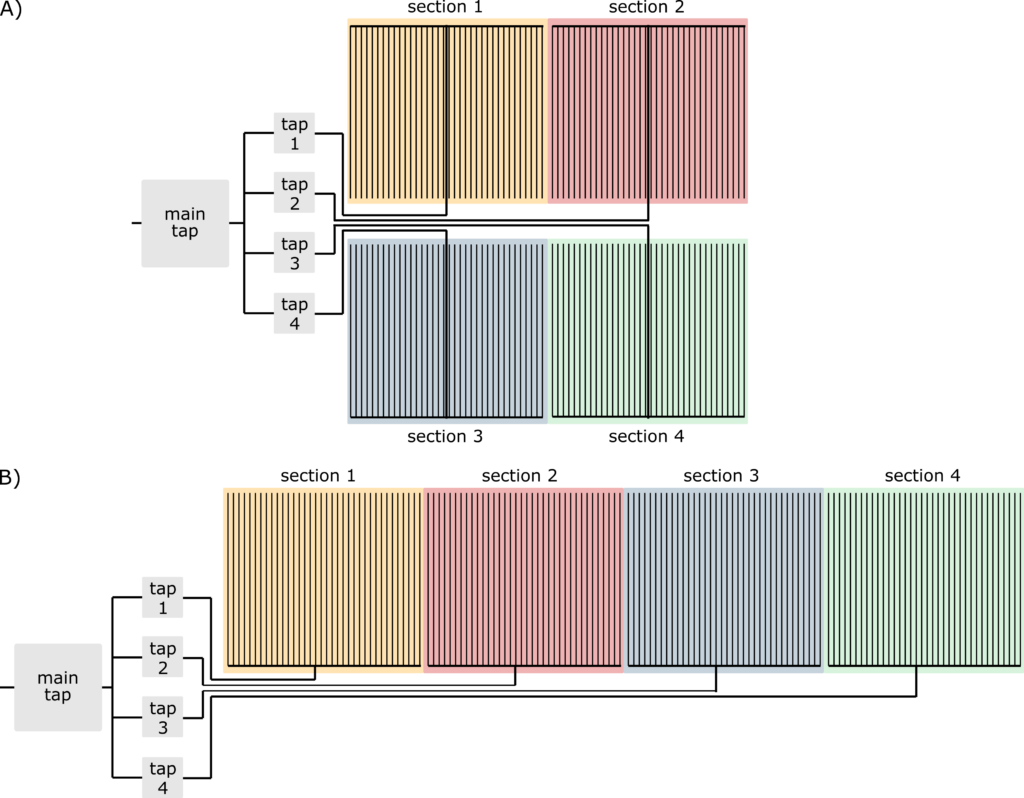
Each greenhouse is unique and we thus had to optimize our sampling scheme for each one of them. The first two sampled greenhouses consisted of four tap sections (“kraanvakken“) with individual irrigation systems. The samples were taken from the main tap of the greenhouse (“hoofdkraan“) and from the distribution line at each of the four tap sections (“druppelleiding“). The third greenhouse had a different tap section layout and there we sampled the 204 individual drains (“goten“) that are used to collect drainwater from the plant substrate.
![]() Sampling with our KytoVials is so easy and quick, the team was able to collect over 220 biosecure samples in < 1 hour!
Sampling with our KytoVials is so easy and quick, the team was able to collect over 220 biosecure samples in < 1 hour!
Findings
Tap Sections House Different Microbiomes
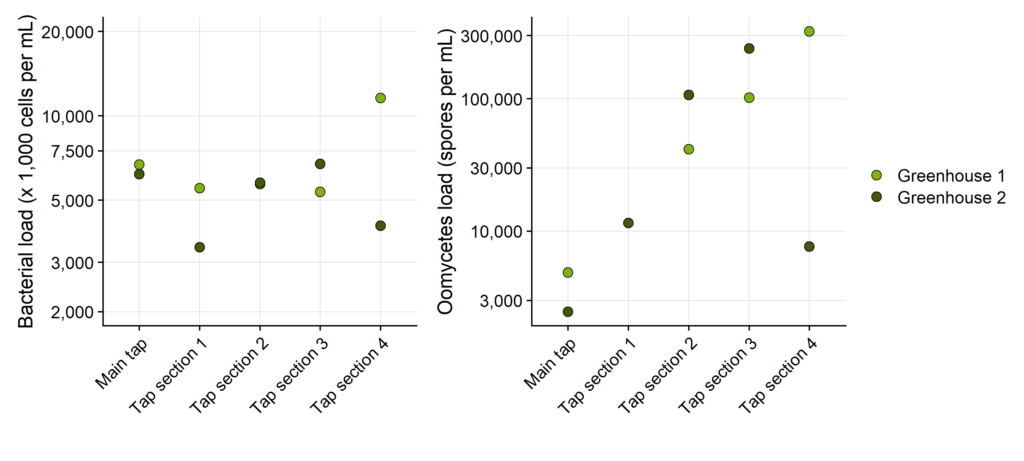
Our supervised learning toolbox KytoFlow was able to pick up some important observations (Figure 1). The average bacterial load in the main tap and irrigation water of the tap sections were almost identical with only a maximum difference of 3x between the tap sections.
Our recently developed algorithm for the detection of common water molds such as oomycetes spores (e.g. Pythium, Phytophthora) revealed that the lowest load was observed at the main tap while larger differences in oomycete load were found across the tap sections (up to 100x).
In simple terms: the microbial water quality strongly deteriorated over the tap sections specifically due to the accumulation of water mold spores. Tap sections 3 and 4 were found to be of higher risk for greenhouse #1, and sections 2 and 3 for greenhouse #2.
![]() Fun fact: A big advantage of our Oomycetes algorithm is that it is able to identify the zoospores, which are the motile phenotypes of these water molds, and pose the highest risk for disease migration.
Fun fact: A big advantage of our Oomycetes algorithm is that it is able to identify the zoospores, which are the motile phenotypes of these water molds, and pose the highest risk for disease migration.
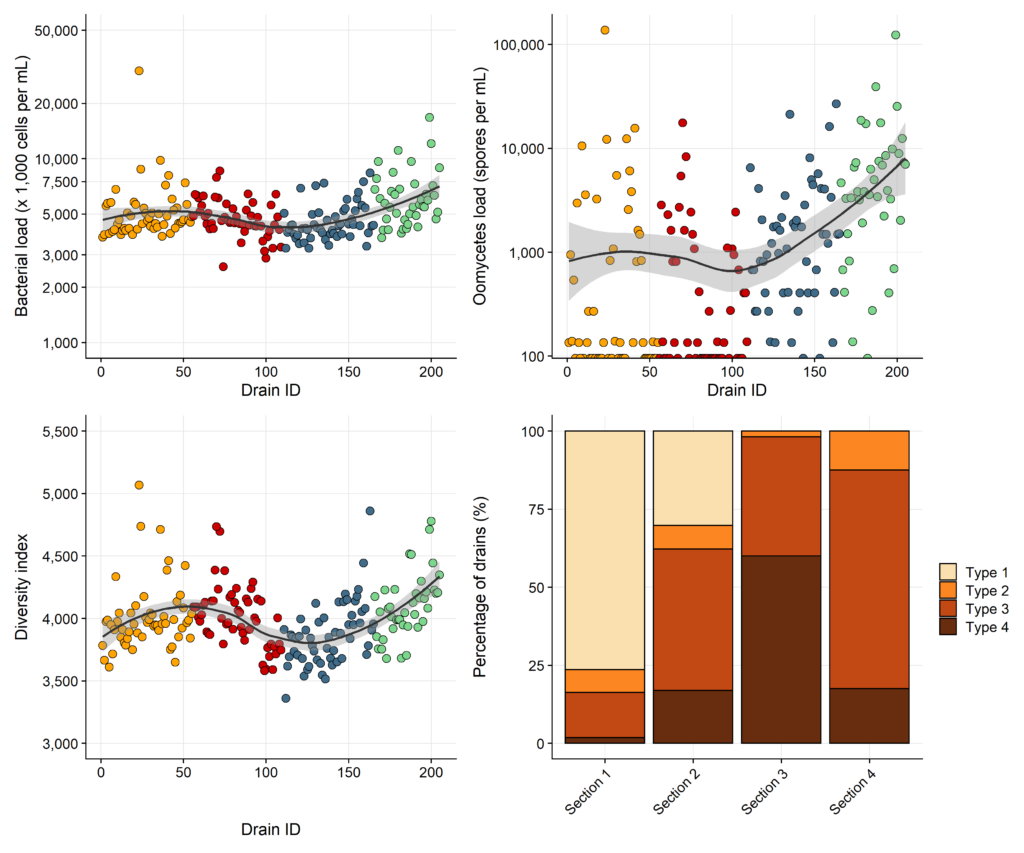
Drain Microbiomes Differ Across Tap Sections
Greenhouses are known to have hotspots for microbe-related problems as well as differences in crop performances between production rows. The drains in a greenhouse carry the microbiome from the input water to the plant and substrate microbiomes. The microbiome can thus change considerably due to differences in plant exudates, climate, or farm management. For Tomato Masters, we completely screened the microbial water quality of all production rows (Figure 2).
 Bacterial and Water Mold Pressures Can Differ Strongly Between Drains
- 10 % of all drains could be classified as hotspots (based on IQR of 1.5).
- Every tap section has hotspots for water molds and bacterial growth.
- Tap sections #1 (orange) and #2 (red) were the cleanest for water molds, but there were many drains with over 1000-fold higher spore loads.
- Tap sections #2 (blue) and #4 (teal) had elevated spore loads for nearly all drains.
Diversity and Microbiome Types are Dependent on Tap Section
- The microbial diversity, which is a proxy for a healthy and resilient microbiome, showed a wavy pattern throughout the greenhouse.
- Drains with the highest diversity were located at the beginning and end of the tap sections.
- We identified four different types of microbiome in the drains. Tap sections 3 and 4 were strongly enriched in other microbiome types than the clean drains (1 and 2). More than 50 % of all drains had a type 3 or type 4 microbiome.
Take Home
- Microbial hotspots exist in greenhouses and they can be found both within individual tap sections, as well as concentrated within specific tap sections.
- There are gradual gradients in microbiome characteristics found across the drains, suggesting climate and design related impacts (ongoing work – part 2).
- Both incoming and irrigation water can be highly variable in quality despite originating from the same input water.
- Different drains house different microbiome types, bacterial load and diversity and oomycetes load. Targeted and precise management of these hotpots will be the key.
We hope these data have showcased that the routine analysis of microbiomes is crucial and and that it is the key to improved microbiome management. We believe that farmers can now use these data feeds to create more stable microbial water quality conditions for the benefit of their crops via the targeted use of biostimulants, disinfectants, and other products.
Stay tuned for the launch of our horticulture services which will include the following benefits:
- Weekly analysis and next business day reporting
- Logistics arranged for you
- Flexible sampling schemes
- Fixed monthly cost
So What’s Next?
In part 2 of this work we’ll discuss more in-depth technical results on how we can relate these microbiome health characteristics to farm KPIs such as row-based production numbers and climate measurements.
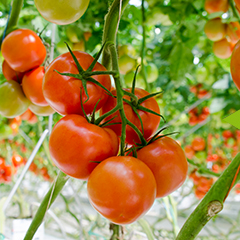
About Tomato Masters
Tomato Masters is an innovative Flemish family business that is specialized in the hydroponic farming of tomatoes. The company owns 21 hectares of horticulture, spread across over four greenhouses. Sustainability is one of the key company values and therefore there is a strong effort to use water as efficiently as possible.
Curious about the microbiome health status of your greenhouses?